This study has been jointly commissioned by Cruise Lines International Association (CLIA) Australia in collaboration with Australian Cruise Association (ACA).
It represents an Economic Impact Assessment (EIA) of cruise tourism in Australia for the 2022-23 season (financial year).
COVID-19 Pandemic
On 18 March 2020 the Australian Government declared a human biosecurity emergency in relation to the COVID-19 pandemic which forbade international cruise ships from entering Australian ports. Cruises effectively ceased on that day.
Consequently, in the 2019-20 cruise tourism season activity only occurred from 1 July 2019 to 18 March 2020 and the economic impact was reduced in that season, however, as the peak cruising season is generally October to March the reduction in cruise tourism related expenditure for the season only decreased by 12% compared to 2018-19.
The ban on international cruise ships ended on 17 April 2022. This report therefore represents the first complete season of cruise tourism activity since 2018-19.
Economic Impact of Cruise Tourism
The national economic impact of cruise tourism in Australia for 2022-23 is based on the aggregation of all passenger, crew and cruise line expenditure at each port or destination visited by a cruise ship during the season.
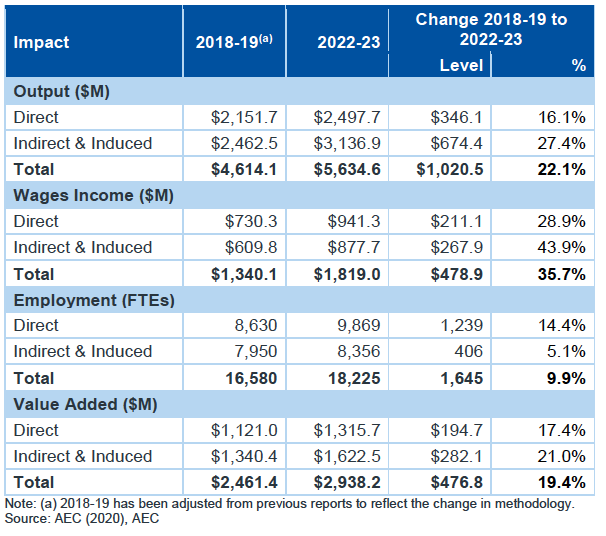
Table E.1 below summarises the estimated national economic impacts generated by cruise tourism expenditure, converted to cruise tourism output, in Australia in 2022-23 as:
- Total output of $5.63 billion, including direct output of $2.5 billion.
- Total wages income of $1.82 billion, including $941 million in direct income and $878 million in indirect and induced wages income.
- Total supported employment of 18,225 full time equivalent positions (FTEs), including 9,869 direct positions and 8,365 indirect and induced positions.
- Total value-added impact of $2.94 billion, including a direct impact of $1.32 billion.
Table E.1 National economic impacts of cruise tourism
Key Cruise Tourism Statistics
Despite fewer ships (> 100 pax) operating the 2022-23 cruise tourism season saw an increase in the number of Australian destinations reported as visited,1 an increase in cruise ship visits, and the number of cruise ship visit days compared to the 2018-19 season. All expenditure measures grew from previous seasons.
Passenger and crew expenditures are derived from past Australian cruise ship surveys indexed by the consumer price index (CPI) (ABS, 2023). No new surveys have been undertaken since 2019-20 except for an international passenger survey undertaken in Sydney over January to March 2023 (AEC, 2023).
Cruise line expenditure is sourced via survey from local CLIA members and extrapolated to the entire population of cruise lines and their operations in Australia.
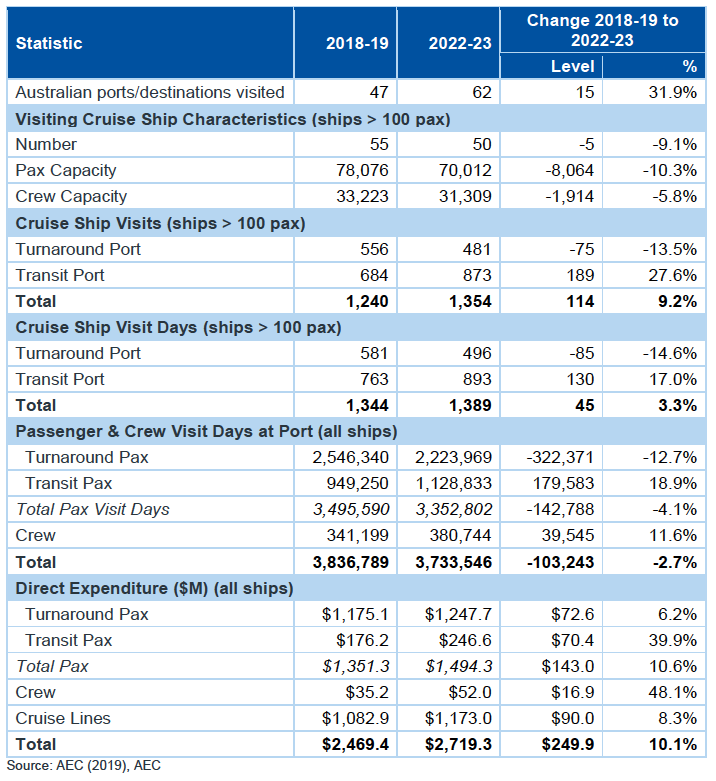
Cruise tourism’s statistics in the 2018-19 and 2022-23 seasons are summarised below.
Table E.2 Australian cruise tourism statistics