PURPOSE OF THE STUDY
This study has been jointly commissioned by Cruise Lines International Association Australia (CLIA) in collaboration with Australian Cruise Association (ACA). It represents an economic impact assessment of cruise tourism in Australia for the 2018-19 financial year.
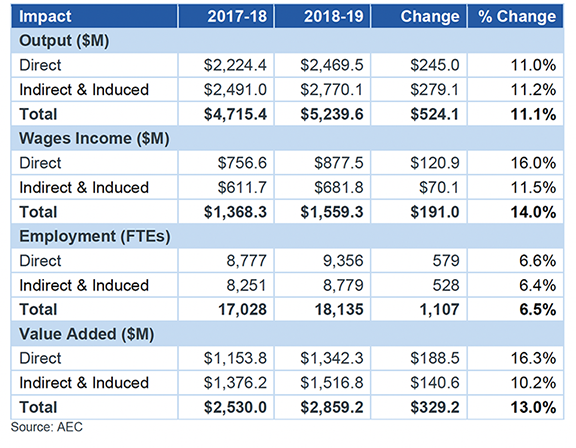
ECONOMIC IMPACT OF CRUISE TOURISM
The national economic impact of cruise tourism in Australia for 2018-19 is the aggregation of all passenger, crew and cruise line expenditure at each port visited by a cruise ship during the year. Table E.1 below summarises the estimated national economic impacts generated by the cruise industry in Australia in 2018-19 as:
- Total output of $5.2 billion, including direct expenditure of 2.5 billion.
- Total wages income of $1.6 billion, including $878 million in direct income and $682 million in indirect and induced wages income.
- Total employment impacts of 18,135 full time equivalent positions (FTEs), including 9,356 direct positions and 8,779 indirect and induced positions.
- Total value added impact of $2.9 billion, including a direct impact of $1.3 billion.
Table E.1 National Economic Impacts of Cruise Tourism
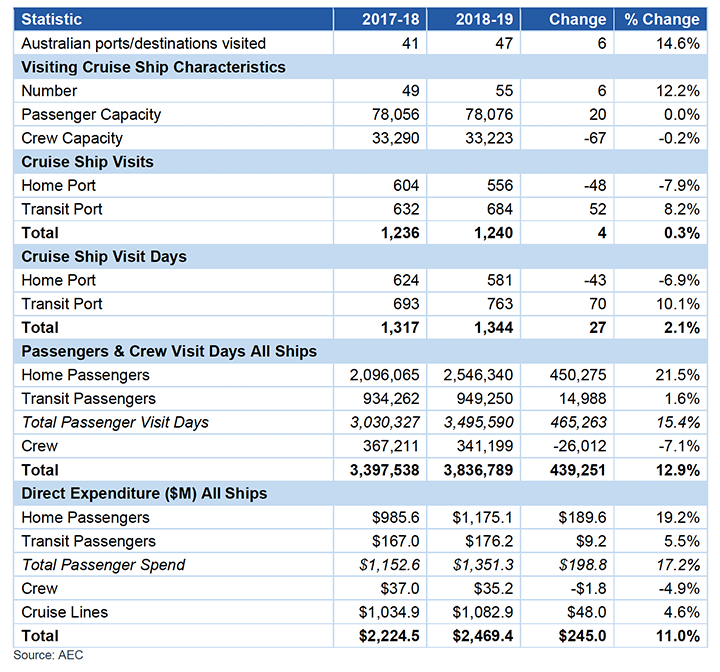
KEY CRUISE TOURISM STATISTICS
2018-19 saw a significant increase in the number of Australian destinations and a slight increase in cruise ship visits, the number of cruise ship visit days and passenger days in port. Subsequently all expenditure measures grew with the exception of crew expenditure.
Passenger and crew visit days and expenditures are impacted by improvements to destination visit assumptions largely based on passenger and crew surveys undertaken during the season. Passenger and crew expenditures are derived from past Australian cruise ship surveys indexed by the consumer price index (CPI) and surveys undertaken in Sydney during the 2018-19 season.
Cruise line expenditure is sourced via survey from local CLIA members and grossed to the entire population. This year’s survey saw improved reporting at the destination level and these were used to estimate cruise line operational expenditure in destinations.
Cruise tourism’s statistics in the 2017-18 and 2018-19 years are summarised as:
Table E.2 Australian Cruise Tourism Statistics (Ships > 100 Pax unless stated)