
PURPOSE OF THE STUDY
This study represents an economic impact assessment of the cruise industry in Australia for the 2015-16 financial year. The information and analysis presented in the report ensures a better understanding of the size, growth and economic significance of the industry to the Australian economy to assist with future planning and strategy. The study has been undertaken on behalf of Australian Cruise Association (ACA) with the support of Tourism Australia. The 2015-16 study is the twelfth consecutive year the study has been undertaken.
RESEARCH METHODOLOGY
The 2015-16 economic impact assessment for the cruise industry is an update of the previous study completed in 2014-15. The 2015-16 study incorporates data from passenger and crew surveys undertaken during the year in the Whitsundays. A number of major changes have been incorporated in the 2015-16 study, including:
- Partial turnarounds are now included.
- Crew going ashore when anchoring has been changed to 10%.
- Some regional ports/destinations passenger and crew expenditure proxy changed from Cairns to Bunbury.
- Bunker purchasing has been changed from 0.03t/GRT in 2004-05 to 0.01t/GRT in 2014-15. The price of bunker has fallen considerably over the last few years reducing expenditure on bunkering.
- Cruise line corporate expenditure has been revised using BREA (2014).
SIZE & GROWTH OF THE CRUISE INDUSTRY
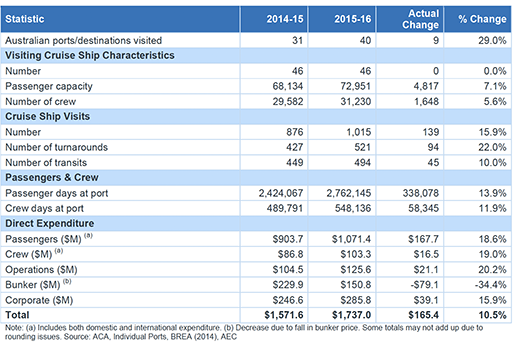
The Australian cruise industry recorded an increase of 15.9% in the number of cruise ships visits in 2015-16. The cruise industry’s growth trends in the 2015-16 year are summarised as:
Table E.1 Australian Cruise Industry Statistics
EXPENDITURE ASSOCIATED WITH THE CRUISE INDUSTRY
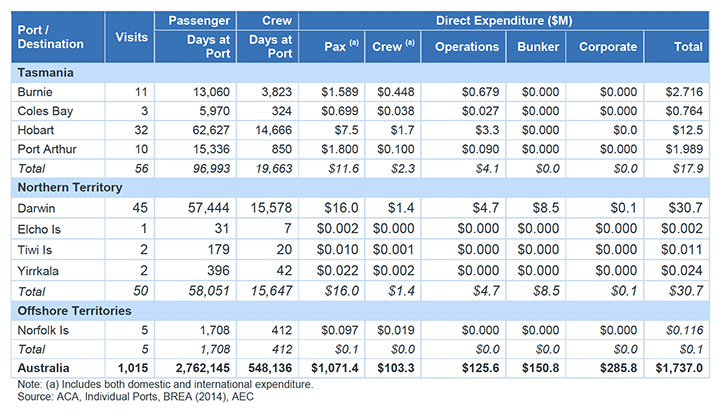
The direct expenditure (including both domestic and international passenger, crew, operator and corporate) by the cruise industry in Australia in 2015-16 was estimated at $1.734 billion, compared with $2.030 billion in 2014-15 (see Table E.2). This equates to a 14.6% decrease over the past year, with the decrease in bunker expenditure (due to price) offsetting growth in crew and passenger expenditure of 18%.
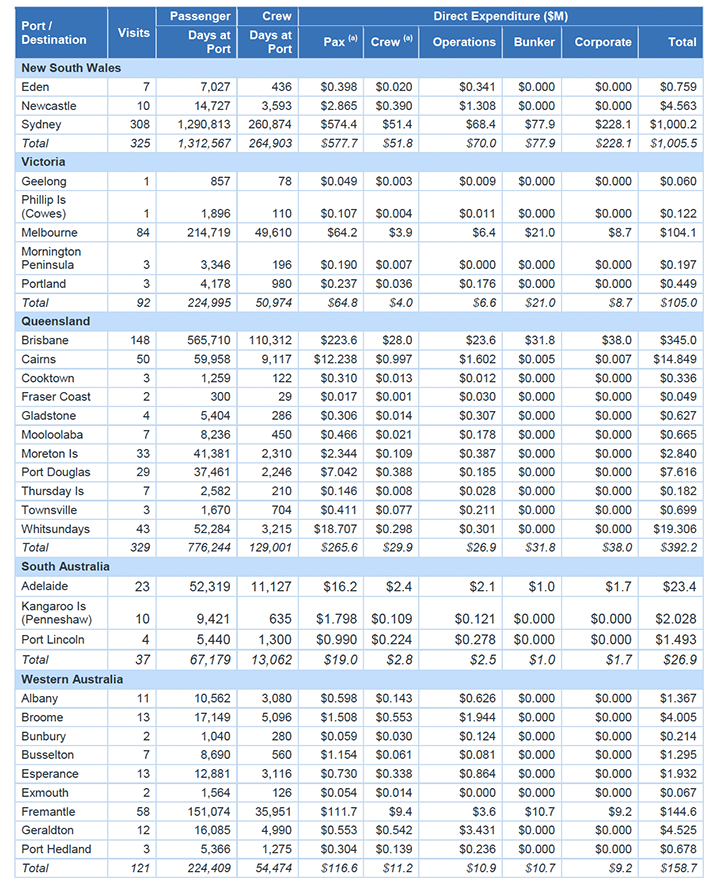
Table E.2 Summary of Total Expenditure associated with the Cruise Industry in Australia, 2015-16
ECONOMIC IMPACT OF THE CRUISE INDUSTRY
Economic impact analysis can be used to trace the flows of spending associated with specific activities in a region to identify changes in output, jobs, income and value added. The economic impact analysis of the cruise industry requires a carefully structured approach. The approach used in this study provides separate estimates of the direct and indirect impact of the industry. The direct economic impact of the cruise industry includes the output, jobs, income and value added created by passenger, crew, operator and corporate expenditure. On top of this, there is also the direct employment of Australians on cruise ships, primarily those based in Australia.
The national economic impact of cruise ship visits to Australia in 2015-16 is the aggregation of all international passenger and crew expenditure, cruise ship operator expenditure at each port and destination visited by a cruise ship in 2015-16 and corporate administrative and professional expenses including travel agent commissions. Expenditure by Australian passengers visiting Australian ports and destinations as part of a cruise does not constitute a net impact; rather the expenditure is a transfer from one part of the economy to another. However, estimates for these are also calculated and presented.
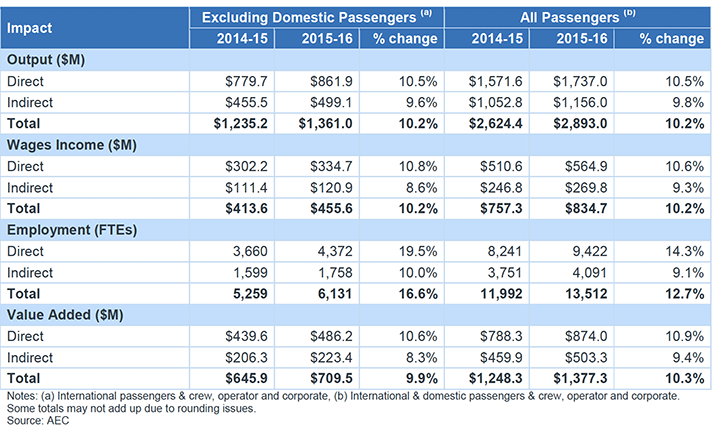
Table E.3 below summarises the estimated national economic impacts of the cruise industry in Australia in 2015-16 (all passengers) compared with 2014-15. They are:
- Estimated total output of $2.893 billion in 2015-16, including direct expenditure of $1.737 billion. This was a 10.2% increase from 2014-15 when total output was estimated at $2,624 billion.
- Estimated total wages income of $835 million, including $565 million in direct income and $270 million in indirect or flow on wages income. This was 10.2% higher than the corresponding 2014-15 figure when total wages income was estimated at $757 million.
- Estimated employment impacts of 13,512 full time equivalent positions (FTEs), including 9,422 direct positions and 4,091 indirect positions. This was an 12.7% increase from 2014-15 when total employment was estimated at 11,992 FTEs. In addition to employment generated by onshore spending when at port, it is estimated around 1,500-2,000 Australians are employed on cruise ships, mainly in the ports where cruise ships are based such as Sydney, Melbourne, Brisbane, Fremantle and Cairns.
- Estimated total value added impact of $1.377 billion, including a direct impact of $874 million. This was a 10.3% increase from 2014-15 when total value added was estimated at $1.248 billion.
Table E.3 National Economic Impacts of the Cruise Industry in Australia
TWELVE YEARS OF GROWTH
Since the first economic impact of the cruise industry in Australia, compiled in 2004-05, there has been significant growth in the industry. From 2003-04 to 2015-16:
- The number of ports/destinations visited has more than doubled from 16 to 40.
- The number of cruise ships visiting has doubled from 23 to 46.
- The passenger capacity of visiting ships has doubled from 24,380 to 72,951.
- The number of cruise ship visits has grown from 325 to 1,015.
- The percentage of turnaround visits to transit visits has grown from a low of 32% in 2007-08 to a high of 105% in 2015-16.
- Total passenger days in port has grown more than six fold from 366,322 to 2.762 million.
- Estimated passenger expenditure has increased nearly twelve fold to reach $1.071 billion.
- Total industry expenditure is estimated at $1.737 billion, increasing from $155 million in 2004-05.
GROWTH POTENTIAL OF THE CRUISE INDUSTRY
Ports and destinations around Australia continue to improve their facilities in response to increased frequency of visits and size of cruise ships. The biggest announcement was that for a $100 million mega ship cruise facility at Luggage Point at the mouth of the Brisbane River. Newcastle and Melbourne also upgraded their facilities for larger ships.
Meanwhile ever larger ships will visit Australia including:
- Pacific Explorer (P&O Australia, 77,000GRT, 2,000pax)
- Norwegian Star (Norwegian Cruise Line, 91,740GRT, 2,348pax) will commence visits in 2016-17
- New P&O Australia ship ordered for 2020 (135,500GRT, 4,200pax)
- Norwegian Jewel (Norwegian Cruise Line, 93,502GRT, 2,376pax) will commence visits in 2016-17.
After recording growth of 15.9% in 2015-16, cruise ship visits to major Australian ports are expected to increase by approximately 250 visits (24%) that will flow onto an estimated 1,260 ship visits in 2016-17, which is higher than the growth trend over the last decade. Preliminary estimates for 2017-18 at this stage indicates a further 10% growth.